
If you run a transport or logistics operation, you’ve heard the same explanation a thousand times.
“Sir, traffic.”
Sometimes it’s true. City congestion, diversions, peak-hour loading restrictions – traffic does slow everything down. But here’s what fleet owners and operations managers quietly learn the hard way :
Traffic is the easiest reason to say.
However, it’s not always the real reason.
A big share of delays happen after the route is planned and the vehicle is already out. The road might be clear, but the operation isn’t. And that’s the difference between moving vehicles and controlled deliveries.
This blog breaks down the most common non-traffic causes of delays, how to spot them early and the data points you need to run a calmer, more predictable fleet.
Traffic is visible. It’s also “unquestionable.” When a delivery is late, blaming traffic avoids conflict :
So traffic becomes the default story.
But in reality, the most painful delays in logistics are the ones that are avoidable. Those delays come from poor handoffs, missing information, unclear accountability and slow exception handling.
You don’t fix those with a faster driver or a new route.
You fix them with visibility and alignment.
Let’s talk about what actually causes late deliveries when the roads aren’t the issue.
This is one of the most underrated killers of delivery performance.
One report found that 74% of businesses point to bad address data as the cause of up to a quarter of their deliveries failing.
And another data point : Address-related issues can represent around 40% of failed delivery attempts.
Even if you don’t count it as a “failed attempt,” this translates to delays, re-routing, extra calls and wasted hours.
This shows up in every last-mile environment :
These aren’t traffic problems. They’re coordination and timing problems.
A common operational reality –
Dispatch learns something went wrong after the driver returns, not while it’s still fixable.
Limited real-time visibility meant dispatchers learned of failures only after drivers returned; with tracking and intervention, they reported a 22% jump in first-attempt success.
If you only find out at the end, you can’t prevent the delay.
This sounds basic, but it creates chaos :
If identity isn’t clearly tied to the vehicle at the start of a shift, every incident becomes a debate.
Paper POD, manual signatures, unclear notes, missing stamps : these often delay closure even when delivery happens.
Manual processes invite errors and lost documentation and waste driver time.
This is where operations pain becomes finance pain :
This doesn’t just affect salary. It affects morale and trust.
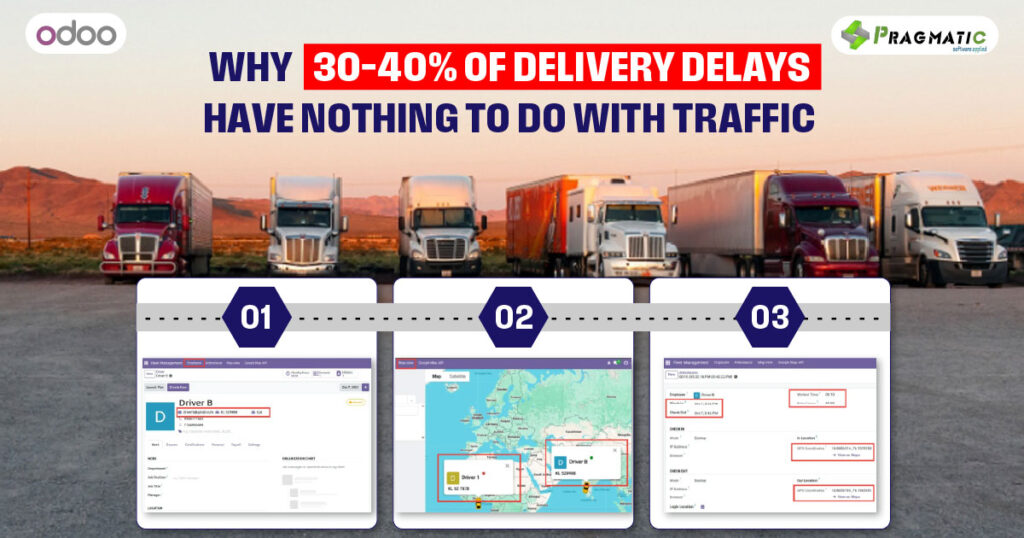
So how do we justify the idea that 30–40% of delivery delays have nothing to do with traffic without turning it into a random stat?
We can’t honestly claim a single global percentage for every industry and geography. But we can validate the pattern using real reported contributors:
When you add coordination issues (recipient unavailable, restricted access, time windows) and internal visibility gaps (dispatch finding out too late), it’s very realistic for a large portion of “late deliveries” to be operational, not traffic.
If you focus only on traffic, you’ll keep missing the fixable causes of delay.
There’s a window where most fleets are effectively blind :
Without timely, transparent updates, dispatchers and customers are left guessing, and visibility breaks down.
And this is where the daily emotional load comes from.
If you’ve been in fleet operations, you know the soundtrack:
That’s not a “traffic” problem. That’s a visibility gap.
If you want fewer delays that “mysteriously happen,” you need five basics. Most fleets have them… but scattered across phone calls, WhatsApp, registers and different systems.
Not just the driver’s name in HR, but who is on duty right now.
Why it matters :
This is the anchor for every incident review.
If you can’t answer “who had the vehicle,” you can’t close disputes quickly.
Not for micromanagement. For intervention.
It lets dispatch –
Research reviews on last-mile optimization repeatedly highlight real-time tracking and IoT-enabled visibility as drivers of proactive decision-making and reduced delivery delays.
This is the bridge between operations and payroll.
If working hours are unclear, disputes become routine.
When things go wrong, you don’t need a 50-page report.
You need :
If attendances can be logged into your ERP, you can record time and location for check-in/check-out and the check-in/out flow can log IP address and GPS coordinates depending on the method used.
That kind of audit trail isn’t about policing. It’s about reducing confusion.
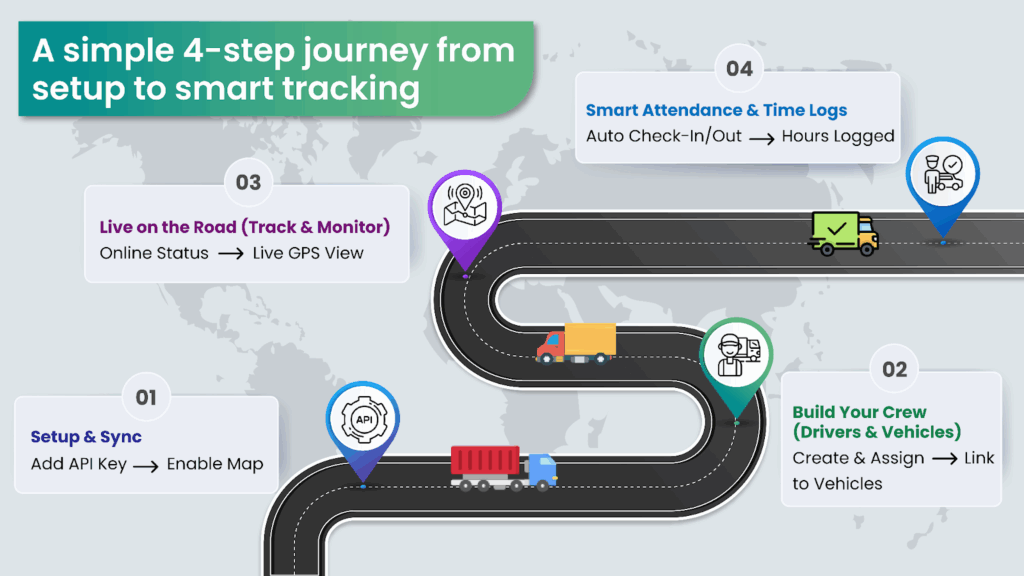
Here’s a simple, realistic approach that works for fleets of 5 vehicles or 500.
If your dispatch team calls drivers for updates multiple times per trip, the system is broken.
Set a goal :
Use basic validation :
This matters because bad address data is strongly tied to failed deliveries and delays.
The difference between a good fleet day and a bad one is often how early you see the problem.
Real-time visibility makes interventions possible before failure becomes inevitable.
Post-delivery reconciliation shouldn’t take days.
When you connect attendance, location signals, and driver identity, audits and disputes stop being emotional.
Odoo is strong because it’s integrated. You can manage employees, vehicles, attendance, communication and even customer interactions inside one system.
But many fleets still struggle with one thing:
Operational visibility that connects the shift (who), the asset (vehicle), movement (where) and time (hours) in one continuous workflow.
That’s exactly where most teams fall back to WhatsApp and calls.
This is where Fleet Tracking Management by Pragmatic TechSoft fits naturally, without forcing fleets into a separate tracking universe.
It’s designed around the operational truth that :
So instead of “another tool,” you get a connected workflow inside Odoo :
The benefit isn’t the map itself.
The benefit is what fleet owners actually care about :
Traffic is real. But it’s also the easiest excuse.
When fleets connect driver identity, vehicle assignment, on-duty visibility and worked hours, delays become easier to prevent and disputes become easier to close.
If your operation is tired of chasing updates, the next improvement isn’t “faster driving.”
It’s cleaner visibility. Get in touch with our team to learn more about how you can achieve this for your fleet operations!
The exact share varies by geography and operation type. But evidence strongly shows large non-traffic contributors like address issues: address-related failures can be ~40% of failed attempts, and bad address data is cited as a cause for up to a quarter of failed deliveries. DispatchTrack+1
Address issues, recipient unavailability, access restrictions, dispatch visibility gaps, unclear driver-vehicle accountability, and manual POD/reconciliation delays. DispatchTrack+2Enterprise Times+2
The time between dispatch and delivery confirmation when the office lacks timely, reliable updates. That’s where preventable delays and extra calls pile up. Descartes
Driver on-duty identity, driver-vehicle assignment, on-duty location visibility, shift start/end and worked hours, and a basic time-place audit trail.
Odoo’s Attendances app can record check-in/out time and location details, and can log IP address and GPS coordinates depending on the check-in method. Odoo+1
Multiple industry sources and research reviews point to real-time tracking and visibility enabling proactive decisions and reducing delivery delays, mainly by spotting issues early and intervening before failure.

March 10, 2026


Leave a Reply
You must be logged in to post a comment.