Forget the days of rigid, template-bound reporting; Odoo 17’s custom reports are about molding data narratives to fit your unique business context, ensuring that every piece of data you interact with is a step towards informed decision-making.
This blog explores the enhanced reporting features in Odoo 17, with practical examples and code snippets to navigate the realm of custom reports and unlock actionable insights.
ADVANTAGES OF CUSTOM REPORTS IN ODOO 17
- Tailored to Your Needs
Custom reports in Odoo 17 are the linchpin to a tailored data analysis experience. Unlike the one-size-fits-all generic reports, custom reports are crafted to encapsulate the data most pertinent to your operations, paving the path for precise and insightful analysis.
- Real-Time Data Access
The essence of timely decisions lies in real-time data access. Odoo 17 ensures the immediacy of data retrieval and representation through custom reports, keeping you ahead in the fast-paced business arena.
1) TAPPING INTO CUSTOM FIELDS
Custom fields extend the data models to capture additional, critical information, serving as the bedrock of personalized reporting in Odoo 17.
Example :

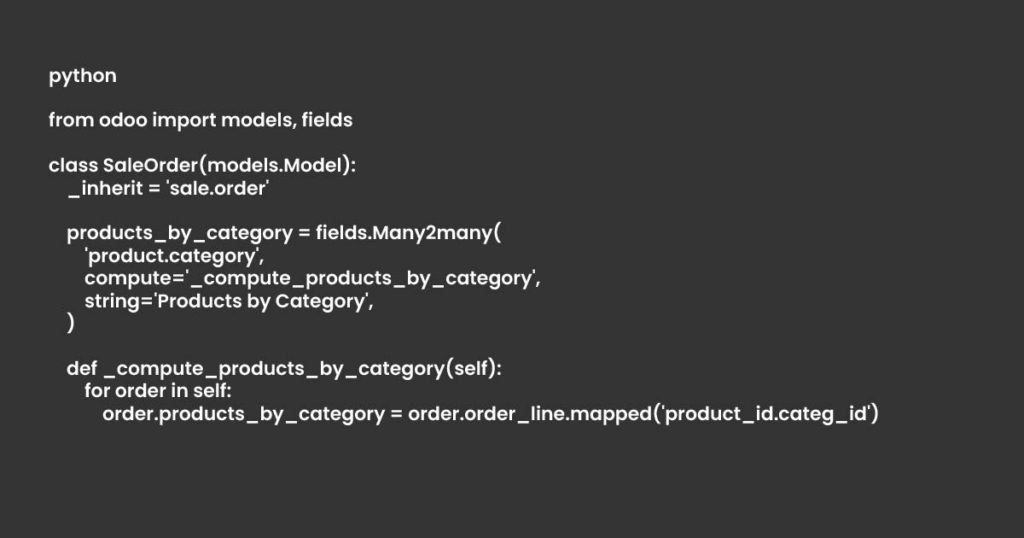
2) LEVERAGING CALCULATED FIELDS
Calculated fields in Odoo 17 enable computations on existing data fields, deriving new insightful fields for reporting.
Example :

3) UTILIZING ODOO STUDIO
Odoo Studio’s user-friendly interface facilitates the creation of custom reports, even for those with minimal technical knowledge.
Step 1: Define Your Reporting Needs
Identify key metrics and data points, determining the layout that would best represent this data.
Step 2 : Dive into Odoo Studio
Employ Odoo Studio’s drag-and-drop interface to build your report.

4) The Power of Group By and Pivot Tables
Group By and Pivot Tables allow for a multi-dimensional view of data, providing a fertile ground for insightful data analysis.
Example :
5) Visualizing Data with Charts and Graphs
Charts and graphs in Odoo 17 offer a visually intuitive way to interact with data, aiding in the identification of trends and patterns.
Example :

6) Enhancing Reports with Customizations
Extend the QWeb reporting engine with custom Python code to add a layer of sophistication to your reports in Odoo 17.
Example :

Odoo 17’s custom reports open a gateway to deeper data interaction, where insights are not merely viewed but thoroughly explored.
With Pragmatic Techsoft as your ally, harness the full potential of Odoo 17’s reporting capabilities to your advantage.
Connect with us for tailored Odoo reporting solutions and stay tuned to our blogs for more insights on maximizing Odoo 17 for enhanced decision-making.