Odoo is a comprehensive suite of business applications including Sales , CRM, Project Management , Warehouse Management , Manufacturing , Financial Management and Human Resources just to name a few. And while working with odoo we gather a lot of transactional data.
“Data is the blueprint of Business”
Data is basically worthless unless you turn that data into intelligence and that intelligence into actions. so why not use your odoo data to understand and analyse the business better and more factually.
And to do that you will need Power BI a business Analytics service by Microsoft.
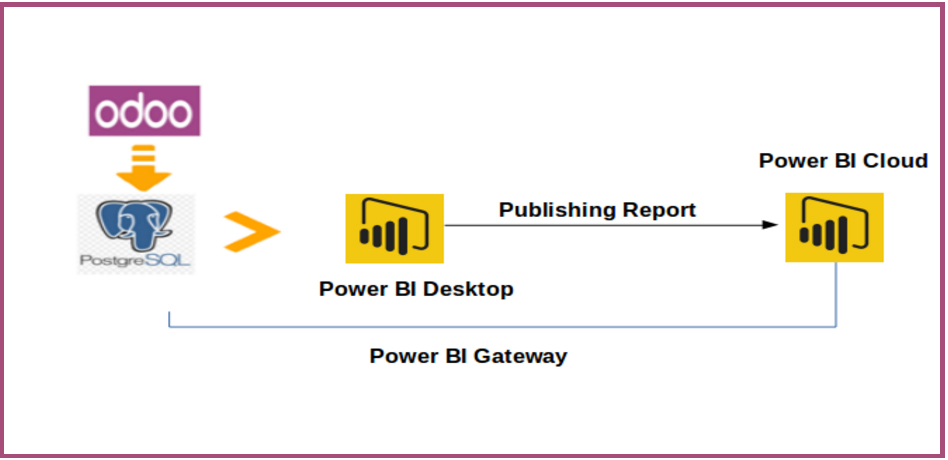
If you are using Odoo by default your data gets saved into postgres relational database.
Using SSIS (sql server Integration services) Move the data from local db to SQL Data Warehouse in Azure Cloud. (you will need azure cloud subscription)

Once the data is in Azure Cloud. You can connect the data to power BI Cloud directly (you will need power BI service subscription)

Click on the connect to live data in Azure SQL Data Warehouse.
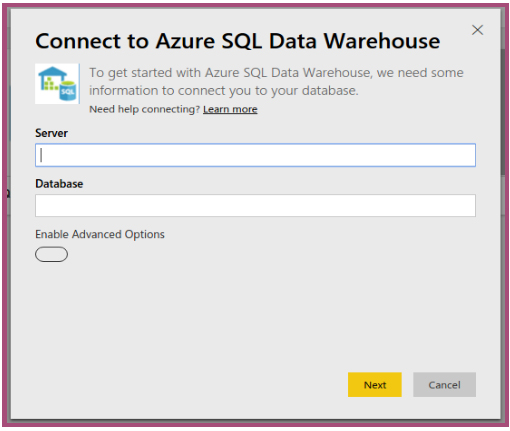
Fill in the above details and start Creating reports in power BI.
Another way is you can download the open source desktop version of the Power BI built the dashboards on the local system and then publish the same over Power BI Cloud.
This enables more features to the dashboard.
Power BI has ready to use charts that just needs the data in correct format. Power BI supports below visualizations like bar,column,graph,tree,pie,table,crosstab,geographic locations and many more.

And fields shows your datasets in table format. There is a data model at the backend that holds all the relationships between the tables. To make creating charts easy.
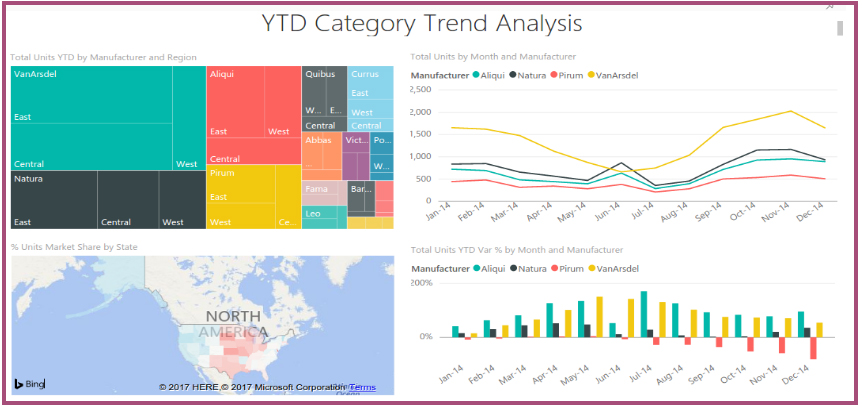
Sample Visualization of Odoo data in a simple Power BI Dashboard created by pragmatic.
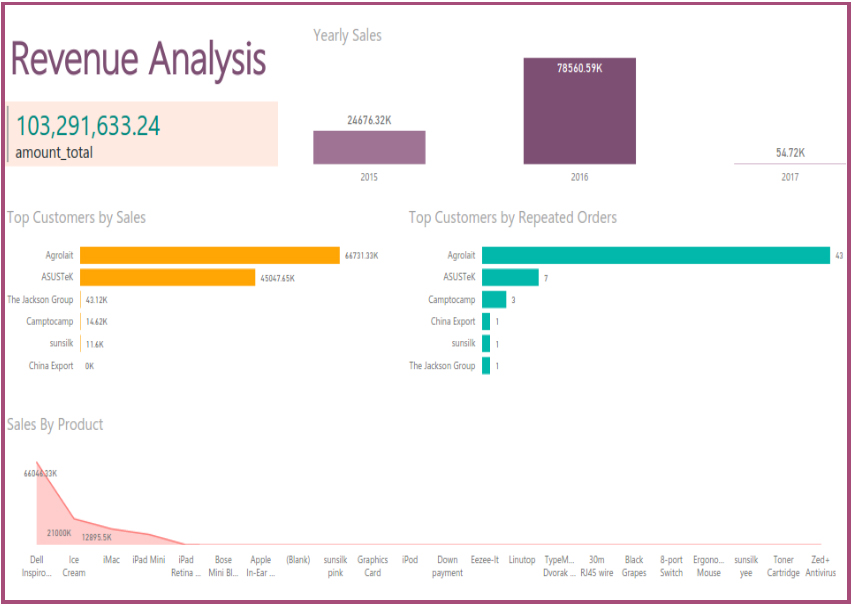
You can get answers to the questions like
- What is my total revenue?
- What is my sales year over year ?
- Who are my top customer by Sales?
- Who are the customers giving repetitive order to me?
- Which products are doing great?
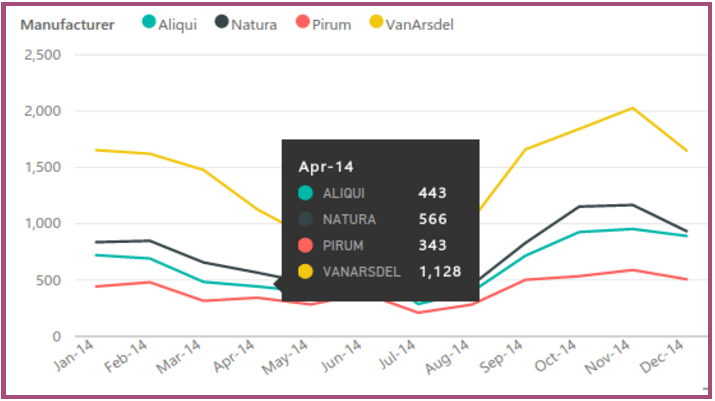
The below screen shows the tooltip with values of different manufacturer.
Geographic Sales Data is shown using a Map